APplus Controlling:
You're in control.

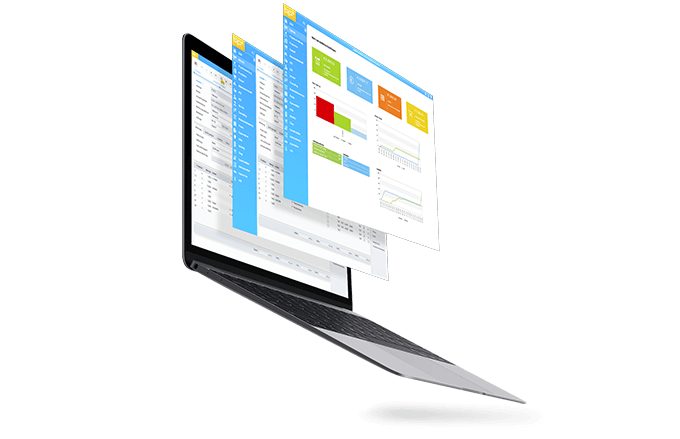
Whether planning, management or control – with the business intelligence tool for controlling and analysis of our APplus ERP system for medium-sized companies, all the information you need is in your hands. With the tool's intuitive operation, you'll be amazed at how quickly you can access the right data.
Components of our Controlling feature

- Analysis of all business areas
- Overview of key figures
- OLAP analyses
- Business Intelligent
Key figure systems
The IMS management solution from our solution partner, IMS AG, unites a high-performance overview of key figures with a process management solution that takes into account resources and areas of responsibility. The direct integration with APplus on a shared Microsoft .NET basis and the clear functional concept of IMS supports users of our ERP system during controlling and analyses for continuously improving their business processes.
With an intuitive user interface, IMS takes into account targets, strategies, risks and balanced scorecards, which are merged in a transparent overview of key figures. The solution's chief strength is how it integrates the processes and organizational structures of medium-sized companies. Managers can use conventional hyperlink technology and drop-down menus to allocate identified key figures to individual departments, resources and areas of responsibility and intervene directly. For this purpose, processes can be mapped flexibly, modeled with simple tools and optimized.

Business Intelligent (BI)
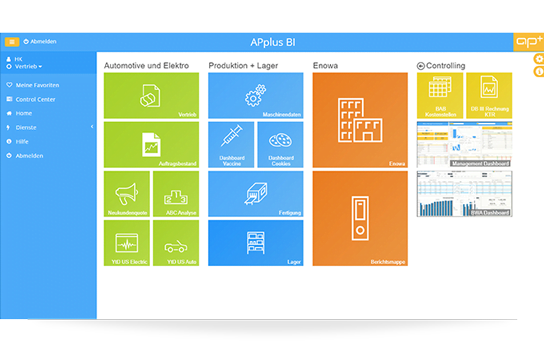
Die Basis für sichere unternehmerische Entscheidungen heißt Business Intelligent. Mit APplus BI bündeln Sie alle Daten Ihres Unternehmens und schaffen eine Transparenz, die Ihre Effizienz steigern lässt. Die Analyse-, Planungs- und Reportingfunktionen unterstützen Sie nicht nur im Tagesgeschäft, sondern helfen Ihnen dabei Risiken besser zu bewerten und Chancen einfacherer zu erkennen. Setzen Sie für Ihr Controlling mit APplus BI auf Kennzahlen- und Frühwarnsysteme, fundierte Analysen und flexible Berichte.
OLAP analyses
The APplus ERP system also enables you to use OLAP analyses (Online Analytical Processing) to compile data from a wide variety of sources and generate relevant information for managing the company (business intelligence). The essential aspect of this process is compressing the data, ensuring a short response time for queries.
Operation could not be easier: Using predefined OLAP cubes, you can carry out analyses in our APplus ERP system and adapt them to your own needs. Of course, you also have the ability to create your own OLAP cubes
APplus OLAP gives you a variety of options for graphical reports and extensive print functions. These include pivot graphs (bar graphs) and pivot tables with the ability to show or hide details.
APplus OLAP lets you export the report to Excel at the touch of a button, giving you the ability to make further changes to the tables. Once reports have been customized to user-specific needs, they are saved in the final form so that they can be generated again at any time with the current data (e. g. monthly reports).
